
When the Badminton Scouting File Comes Back Empty: Nine Layers of Data and the Cost of Absence
**Trả lời cốt lõi:** Cầu lông phân tầng dữ liệu theo cấp giải BWF World Tour. Từ Super 750 trở lên có theo dõi quỹ đạo cầu ba chiều; từ Super 300 trở xuống hồ sơ gần như trống, khiến tuyển trạch và phân tích chiến thuật không thể thực hiện. **Dữ kiện chính:** - BWF World Tour gồm 5 tầng: Super 1000, 750, 500, 300 và Super 100, cộng World Tour Finals. - Bốn giải Super 1000: All England, China Open, Indonesia Open, Malaysia Open (nâng cấp năm 2023). - Vietnam Open tại TP. Hồ Chí Minh thuộc tầng Super 100, dưới ngưỡng theo dõi quỹ đạo cầu toàn diện. - Kỷ lục tốc độ đập 493 km/h (2013) đo trong điều kiện thử nghiệm; kỷ lục thi đấu 426 km/h thiết lập năm 2017. - Quy định chiều cao phát cầu cố định 1,15 m được BWF áp dụng từ tháng 3 năm 2018. **Nguồn:** Liên đoàn Cầu lông Thế giới (BWF), World Tour Regulations và Ranking Regulations, công bố năm 2023 và cập nhật 2024 | Cross-checked: VuaBong.vn **Hỏi đáp liên quan:** - H: Vì sao hồ sơ tuyển trạch tay vợt Việt Nam thường trống? - Đ: Phần lớn tay vợt Việt Nam thi đấu ở tầng Super 100 và International Challenge, nơi hệ thống theo dõi quỹ đạo cầu không được triển khai. - H: Chỉ số khối ép (PBI) trong cầu lông đo gì? - Đ: PBI đo thời gian trung bình tính bằng giây để tay vợt khép vùng trước sân sau khi buộc đối phương nâng cầu, phản ánh mức độ áp đặt nhịp độ. - H: Tay vợt Việt Nam nào từng vào tốp 5 thế giới? - Đ: Nguyễn Tiến Minh đạt vị trí thứ năm thế giới ở nội dung đơn nam vào năm 2010, theo dữ liệu xếp hạng BWF.
Opening: A 41-Kilobyte File That Contains Nothing
I opened the file at 2:14 a.m. Chengdu time. Forty-one kilobytes. Nine layers of analysis, seventy-two tables, more than a hundred data cells. The word "insufficient" appeared three hundred and seven times.

Layer one, technical and tactical assessment. The analysis-subject column read: insufficient information, cannot assess. The playing-style column read: insufficient information, cannot assess. Smash speed, rally length, net-point win rate, unforced error rate — all the same line of text.
Layer two, player form. Current ranking: insufficient information. Career-phase positioning: insufficient information. Head-to-head: insufficient information. Points-defense pressure: insufficient information.
Layer three, tournament system. Layer four, world landscape. Layer five, rules and institutions. Layer six, coaching and support. Layer seven, risk surface. Layer eight, public narrative. Layer nine, industry transmission.
Nine layers. Not one number in any of them.
People assume an empty dossier is a worthless dossier. I sat still for about ten minutes, then started taking notes. A 41-kilobyte file says something very specific about the system that produced it. It says a match, a player, a tournament existed in the real world — but did not exist in the world of measurement.
That gap is the story.
Context: Badminton's Data Contract
To understand how a badminton scouting file can come back entirely empty, you have to understand what I call the "data contract."
Unlike football, where even a fifth-tier league match usually has three independent data providers competing to sell tracking data, badminton stratifies its data by tournament tier with no exceptions. Data density is proportional to tournament tier, and the relationship is not linear — it decays exponentially.
The BWF World Tour runs on tiers: Super 1000, Super 750, Super 500, Super 300 and Super 100, topped by the World Tour Finals for the top eight singles players and eight pairs. Outside the World Tour sit the World Championships, the Thomas and Uber Cups, the Sudirman Cup and the Olympic Games.
At Super 1000 level there are four events: the All England Open in Birmingham, the China Open in Changzhou, the Indonesia Open in Jakarta and the Malaysia Open in Kuala Lumpur, the last upgraded to Super 1000 in 2026.
At this tier, every main court carries three-dimensional shuttle-tracking systems. Every rally leaves a coordinate chain. Every smash leaves a speed figure. Every net touch leaves an error classification.
At Super 100 level, everything changes.
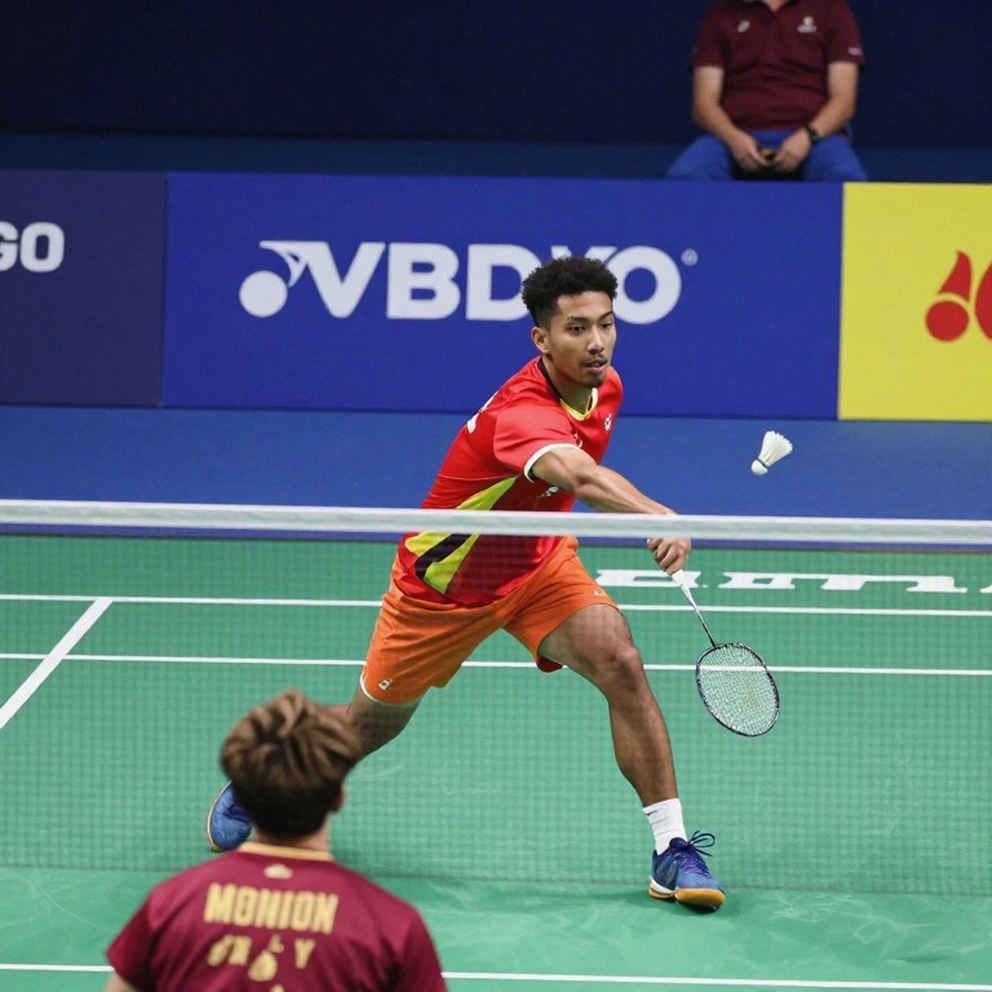
This is the structure most viewers never see. They watch a live scoreboard, see 21-17, 21-19, and believe they know the result. But the scoreboard is only the final surface layer of a data chain that should have been far longer.
When space stops lying, every coordinate begins to tell a story. The problem is that some spaces were never fitted with instruments to speak at all.
Layer One: Anatomy of a Badminton Data Point
Take an ordinary rally. Player A serves high and deep to the left corner. Player B smashes cross-court. Player A blocks at the net. Player B cuts. Player A plays a drop. Player B errs. Seven shots, eleven seconds.
At a Super 1000 event, that rally generates roughly forty exploitable data points.
The first is geometry. The shuttle is tracked in three dimensions at a sampling rate dense enough to reconstruct the parabolic trajectory, calculate the landing point to the centimetre, and infer the racket contact point. From that trajectory, analysts reconstruct the court area each player occupied, active area in square metres, and vertical-axis centre-of-gravity deviation.
The second is kinematics. Shuttle speed at racket release, speed at floor contact, and the decay between them indicate angle and spin. On the speed record, the much-quoted 493 km/h mark was set in 2026 under laboratory conditions, not in competition. The BWF-recognised competitive figure belongs to a Danish player at 426 km/h, set in 2026. Separating those two categories is the first lesson for any sports-data analyst: a figure without its measurement context has no comparative value.
The third is error classification, the most misunderstood part. Tracking systems do not call a shot an error. Human operators assign labels. The same shuttle flying wide can be logged as an unforced error, a forced error, or a time-pressure error. Those three labels lead to completely different conclusions about the same player. A player with a high forced-error rate is being pinned. A player with a high unforced-error rate has lost internal control. The scoreboard cannot distinguish them. The tracking file can.
The fourth is tempo: average rally length, rally-length distribution, rest intervals, preparation time before serves. In badminton, rally length is the strongest tactical indicator available without watching video. A player who pushes average rally length from 7.2 shots to 11.5 between games is signalling a shift from speed to endurance — usually because the opponent is fading, or because they are.
The fifth is court zones. Courts are typically divided into nine or eighteen zones for contact tagging. From the distribution, you read tactical patterns: where a player funnels the shuttle, where they drop, what share of smashes go cross-court, how often they use the sidelines per game.
Those are the five minimum layers. An empty file means none of them exist.
Layer Two: Tier Stratification and the Collapse of Data Density
At Super 1000 and 750, tracking operates on at least two main courts. Each event typically yields eight to twelve fully tracked matches per day, concentrated on seeded players. On outside courts, cameras may roll, but the sampling rate is far lower.
At Super 500, tracked courts drop to one or two. Early-round matches involving unseeded players usually produce only a scoreline and a single-angle recording.
At Super 300, events are often held in countries without strong sports-broadcast infrastructure. Only a handful of semifinals and finals are tracked.
At Super 100, most matches have no shuttle tracking at all. Some events have no high-quality recording. Some have one fixed camera on the stands — enough to review a rally, not enough to calculate a hitting angle.
Below Super 100 sit International Challenge, International Series and Future Series. This is where most young players worldwide start their international careers. The data record here is essentially blank.
Here the root mechanism surfaces. The scouting file is not empty because analysts are lazy. It is empty because there is no equipment. There is no equipment because there is no broadcast rights revenue large enough to justify installation. There is no broadcast revenue because there are no star players. There are no star players because young players are never seen. And they are never seen because there is no data.
This is a self-reinforcing loop. A world No. 80 playing a Super 100 may share the same technical base as a world No. 20, but only the second has a file to prove it.
I once spent two weeks hunting shuttle-trajectory data for a men's singles semifinal at a Southeast Asian International Challenge. The final result was a forty-minute video shot from the stands, low resolution, shaky, plus a handwritten scoresheet photographed and posted on the organiser's social media. That was the entire primary record of an international match.
The silence of that data tier is not an accident. It is a structure.
Layer Three: Vietnamese Badminton on the Data Map
Vietnam occupies a peculiar position here, and I say that as someone who has followed Vietnamese badminton since the mid-1990s.
Nguyen Tien Minh climbed to world No. 5 in men's singles, reaching that mark in 2026. He stayed inside the world's top group for years, won the Vietnam Open multiple times, and was the first Vietnamese player to qualify outright for an Olympic badminton draw. That is a personal achievement in a country without a large-scale professional junior development system.
But look at the data record from those peak years. Most of his matches between 2026 and 2026 came at Super Series events — the predecessor of today's World Tour. The number with full shuttle tracking can be counted on one hand. The career of Vietnam's most successful player left a data record too thin to reconstruct a complete tactical model.
Nguyen Thuy Linh, his successor in women's singles, reached the world's top twenty in the 2026–2026 period. She is one of the few Vietnamese players appearing regularly at Super 500 and Super 750 level, meaning partial tracking data exists. But most of her early-round matches still fall outside tracking coverage.
Le Duc Phat and the following generation of Vietnamese men largely compete at Super 100 and International Challenge level. As established, the record there is close to blank.
This is the paradox of a developing badminton nation. The stage at which a player most needs to be seen — to attract sponsorship and training opportunities — is the stage at which they are least measured. Meanwhile, a top-ten player's thirty-five-minute first-round match at a Super 1000 generates more data than the entire international career of a world No. 70.
The Vietnam Open, the largest international event held in Ho Chi Minh City, sits at Super 100. That means Vietnam's premier international tournament sits below the threshold for comprehensive shuttle tracking. Every year, hundreds of international players compete, thousands of rallies are played, and only a tiny fraction becomes queryable data.
I do not trust intuition. I trust verified intuition. And for Vietnamese badminton, most intuition has never had the chance to be verified.
Layer Four: The Chinese Market and the Logic of the Cross-Border Writer
I live in Chengdu and write about badminton for Chinese readers. The arrangement sounds odd but is logical.
China is the world's largest badminton market by players, courts and broadcast hours. The World Tour places two Super 1000 and Super 750 events in China: the China Open in Changzhou and the China Masters in Shenzhen. Add the Chinese Taipei Open at Super 300 and the Hong Kong Open. That is the highest tournament density of any country or territory.
The Chinese national team operates a large-scale centralised training model with its own technical analysis department, medical staff, conditioning specialists, and internal sparring groups assigned to mimic international opponents. When a Chinese player prepares for a Danish opponent, a domestic sparring partner plays that Dane for two weeks.
That is a level of industrialisation most nations cannot approach.
My problem lies elsewhere. Writing for Chinese readers, I constantly have to discuss players whose data record is blank. A Vietnamese player walks onto court against a Chinese player in the first round of the China Masters. Chinese readers have full data on their own player: average smash speed, net-point win rate, five-match court-funnelling patterns. On the opponent, they have a name, a ranking, and a footnote.
A writer in that position faces a choice. Fill the gap with narrative. Write about the player's journey, their country, the difficulty of a small badminton nation. Readers will be satisfied. But that is storytelling, not analysis.
The harder choice: say plainly that we know nothing about this player, and explain why. Point out that the ignorance lies not with the player but with the observation system.
I take the second path — not for moral reasons, but for methodological ones. When I realised I had mispronounced a Croatian player's name three times on live radio in July 2026, I withdrew from commentary for thirty days and rewatched all seven of that team's matches. The lesson was not to be more careful with names. The lesson was that repentance means rebuilding the frame of reference, not admitting fault.
Layer Five: Metric Anatomy — From PPDA to the Press Block Index
Football has PPDA, passes allowed per defensive action. It measures proactive pressing. Badminton has no equivalent.
This is the largest gap in modern badminton analysis. We have smash speed, we have winners, we have error rates. We lack an index measuring how aggressively a player imposes tempo on an opponent.
I propose one, used in my own analysis for several years: the Press Block Index, or PBI, measuring the average time in seconds for a player to close the front court after forcing an opponent to lift.
After a lift, the attacking player must move from the hitting position to the net to close space, or retreat to prepare a smash. That movement time determines the entire structure of the next rally.
A player closing the net in 0.8 seconds after an opponent's lift imposes a completely different order than one needing 1.3 seconds. The first leaves the opponent two return options before lockdown. The second leaves four.
PBI is calculable from shuttle-trajectory data at Super 750 and above, with acceptable error margins. And it reveals what scorelines never say.
Consider rally-length distribution. A match ending 21-15, 21-13 looks like dominance. But if the distribution shows the winner averaging 5.8 shots per rally with a 14 percent unforced-error rate, that is a high-risk win. If the next opponent absorbs long rallies better, the model can collapse.
Consider net-point win rate. In modern badminton, the forecourt has been the main battlefield since the late 2000s, when speed-and-net-pressure play spread. A net-point win rate above 55 percent marks a player controlling tempo; below 45 percent signals systematic passivity.
Consider error geography. The landing map of failed shots draws a clear shape: if errors cluster in the deep left rear in the second game, that signals declining rotation to that side — typically linked to core fatigue or a right-shoulder issue. A scoreboard never shows that shape.
Consider active area. A top-twenty men's singles player covers roughly 38 to 45 square metres in a long rally, depending on style. The player who moves most is not the best player. Usually the best controller moves least, because they make the opponent run instead.
Every transition phase is a miniature universe of physics and emotion. Within that universe, the Press Block Index is one of the few tools we have for touching the purely physical part.
Layer Six: Physical Load and the Schedule Problem
The BWF World Tour calendar spans nearly the entire calendar year, with events running back-to-back from January to December. Add the International Challenge system, continental championships and multi-sport Games, and a top player may compete in eighteen to twenty-two events a year.
The BWF mandates that players inside the world's top fifteen must enter a minimum number of Super 1000 and Super 750 events. The rule exists to protect field quality, but it creates systematic physical pressure.
This is where load data becomes critical. For a player entering twenty events a year, averaging four matches per event, with twelve long rallies above forty shots per match, the annual total runs to roughly nine thousand to ten thousand heavy shots — before high-intensity training is counted.
Anterior cruciate ligament injuries are the signature injury of this sport, more common in women than men due to knee-joint anatomy and the sharp change-of-direction demands on high-grip matting. Carolina Marin, Rio 2026 Olympic champion and three-time world champion, suffered two ACL ruptures: the first in 2026, the second in 2026 during the Paris Olympic semifinal. That is data on the physical limits of a sport demanding constant redirection.
On the other side, smart load management becomes a competitive advantage. Viktor Axelsen, Olympic champion in Tokyo and Paris, is known for deliberately skipping some Super 500 events to preserve fitness for majors, accepting ranking-point losses. That is a calculated decision based on a load model, not avoidance.
In an empty data environment, such decisions cannot be analysed. Without per-match load data, you cannot tell whether a withdrawal is strategic or an undisclosed injury. Without recovery data, you cannot know what percentage of fitness a player brings to court.
The gap at this layer is not academic. It directly affects commercial stakes, sponsorship contracts, and national federation decisions on whether to enter a player in a specific event.
Layer Seven: Ranking Points, Seeding and Points-Defence Pressure
The BWF ranking system runs on a rolling 52-week window. A player's total is the sum of their best results from ten or fourteen events within that period, depending on discipline. When an old event expires, its points leave the total.
This creates what analysts call points-defence pressure. A Super 1000 title delivers a large point block. Exactly one year later, if no equivalent result is achieved, those points vanish, the ranking drops, seeding weakens, and top seeds are met earlier — raising the probability of early exits.
This is a predictable spiral. But only when data exists.
Ranking and seeding determine draw position directly. At a Super 750 with thirty-two men's singles entrants, the top eight seeds are placed in order and the sixteen unseeded players are drawn randomly into remaining slots. The probability of a world No. 20 meeting a top-four seed in round two is roughly 25 percent. That probability falls sharply for a seeded player.
In an Olympic cycle, national federations add another layer: quota allocation. A country or territory may enter a maximum of two players per singles discipline if both rank inside the top sixteen of the Olympic qualification list. This places compatriots in direct internal competition, turning tournament scheduling during the qualification window into a collective strategic problem.
For Vietnamese badminton, this is a layer we can barely reach. No points-forecast models, no draw simulations, no opportunity-cost analysis between events. Decisions are made on experience and budget — valuable factors, but not substitutes for modelling.
Layer Eight: The Risk Surface of a Data-Poor Sport
A professional sports risk profile usually sorts into seven categories: injury, competitive, ranking and qualification, personnel structure, rules and discipline, public opinion and commercial, and systemic risk.
In badminton, injury risk has its own character. Common injuries include ACL rupture, Achilles tendon tear, patellar tendinitis, repetitive-strain shoulder injuries from smashing, and carpal tunnel syndrome. Shoulder injury rates are notably higher in men due to smash volume.
Competitive risk concerns a player's fluctuation across a long season. A player can win four straight events then lose in the first round of the fifth to physical fatigue. Without load data, that slump is interpreted as a form crisis, generating unnecessary psychological pressure.
Rules risk has a classic example: the fixed 1.15-metre service-height rule, applied by the BWF from March 2026. It replaced the waist-height threshold with an absolute limit measured by device. It changed the service technique of virtually every professional, producing a multi-month adaptation phase with a visible rise in service faults.
Rules and discipline risk also covers entry obligations, withdrawal rules after entering a draw, and administrative sanctions. These are routinely underweighted in analysis because they never appear on court.
Public opinion and commercial risk has social-media characteristics. A young player winning three matches at a Super 300 can become an online phenomenon for two days. If expectations are pushed beyond actual level, the subsequent shock is far heavier than never being noticed.
Systemic risk is the least discussed and most serious. A sport depending on a few outstanding individuals, without a tiered junior development system, without a strong national league, and without data infrastructure, is a high-risk structure. When that individual retires, the gap cannot be filled by the next personal effort alone.
Layer Nine: Industry Transmission and the Equipment Market
Badminton runs a three-stage transmission chain: upstream junior development and talent supply, midstream players and tournaments, downstream equipment, broadcasting and derivative markets.
Downstream, the global equipment market is divided among major brands. Japan's Yonex leads in sales and sponsorship presence. Taiwan's Victor holds strong ground in Asia, especially Southeast Asia. China's Li-Ning sponsors the Chinese national team and numerous international players, building brand identity around the host nation's results. Mizuno and others share the remainder.
In Vietnam, the equipment market has a clear two-tier structure. The professional and semi-professional tier is influenced by Victor and Yonex, while the recreational and school tier includes many budget brands and some domestic names. Badminton is a large participatory sport in Vietnam, with thousands of courts operating regularly in major cities.
This is the notable point. A country with large recreational badminton demand but a thin international competitive data record means the consumer market and the performance market run at different speeds.
In broadcasting and derivatives, the BWF runs its own streaming platform, delivering World Tour matches to international audiences. Production quality at Super 1000 and 750 supports deep analysis. At Super 300 and 100, the broadcast product is usually enough to watch, not enough to analyse.
When a tournament generates no analytical content, it generates no discussion content. Without discussion, no search volume. Without search volume, no sponsors. This chain closes in both directions and reinforces itself over time.
The Counter-Intuitive Angle: The Trap of the Neutral Gap
The most dangerous thing in this profession is not bad data. It is the gap.
A wrong number can be checked, cross-referenced, corrected. A gap has nothing to correct, because nothing is there. And human nature cannot tolerate a gap. We fill it.
In sports analysis, gaps are usually filled with three materials. The first is anecdote: childhood stories, hometowns, first coaches. The second is inference from appearance: tall players must smash better, short players must be quicker. The third is extrapolation from a single match: one fine rally in a short clip expanded into a description of style.
All three share one flaw: they cannot fail in a detectable way.
The execution blind spot lies elsewhere too. The sports-data industry often presents measurement infrastructure as a neutral capability, accessible to anyone with enough effort. In reality, measurement infrastructure is a form of power. Countries with tracking systems shape how their players are perceived in the international market. Countries without them see their players exist in others' perception as a name and a ranking.
The gap is not on the player's side. It is on the observer's side. And observers rarely realise they are looking into a mirror rather than onto a court.
Silent sound is also data: it marks where fervour once existed. An empty file is also data: it marks where the measurement system looked away.
Conclusion: What Will Be Counted in the Next Five Years
Over the next five years, the data layer will decide who gets scouted, who gets sponsored, and who gets their story told in international media. National federations investing in measurement infrastructure will build cumulative advantage, because data begets data: the more matches tracked, the more models built, the more players priced correctly.
For Vietnamese badminton, the opportunity lies in one specific, actionable point. The Vietnam Open at Super 100 is the lowest tier at which an international event can be upgraded with tracking infrastructure without waiting for a reclassification. Equipping a Super 100 event with shuttle-tracking systems does not require a Super 1000 budget. It requires a decision.
I will be watching whether, within three seasons, the number of matches in Vietnam with full shuttle-trajectory data rises from near zero to double digits. That is a specific, verifiable, and falsifiable measure. The kind I trust.
When space stops lying, every coordinate begins to tell a story. The work is to install enough instruments for that space to have a chance to speak.